I4 Engineering
A Flutter Android App for Electrical Monitoring and Reports
“A mobile workflow for moving from a company overview to an individual electrical reading and a shareable report.”
What the Android App Is Built For
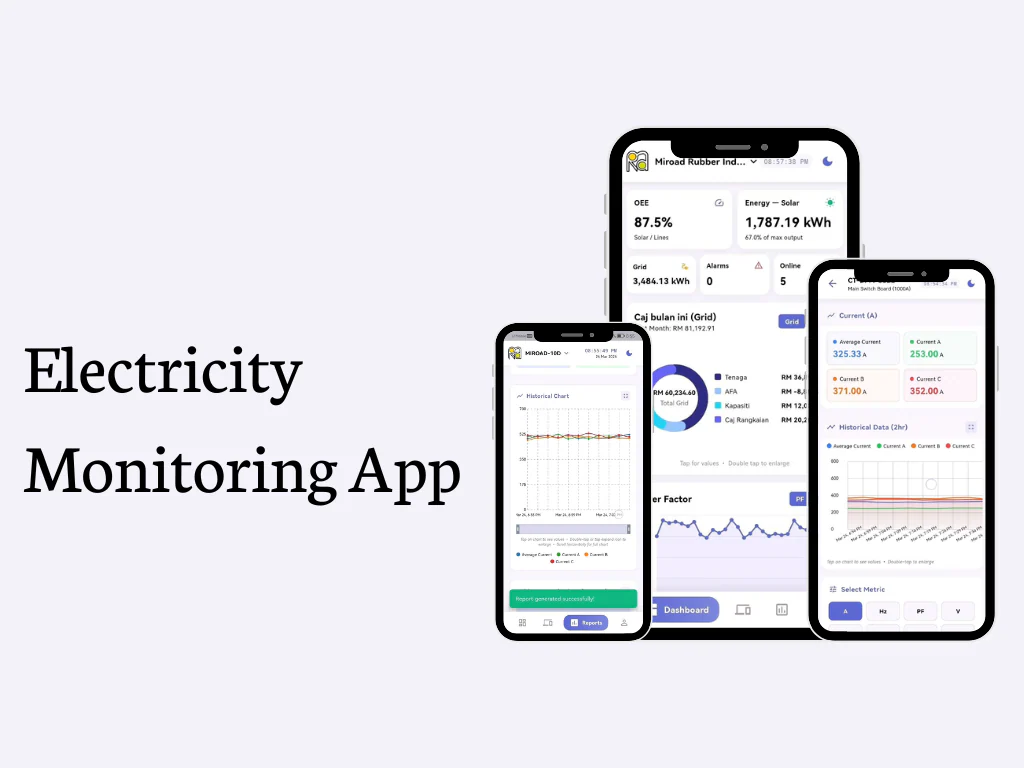
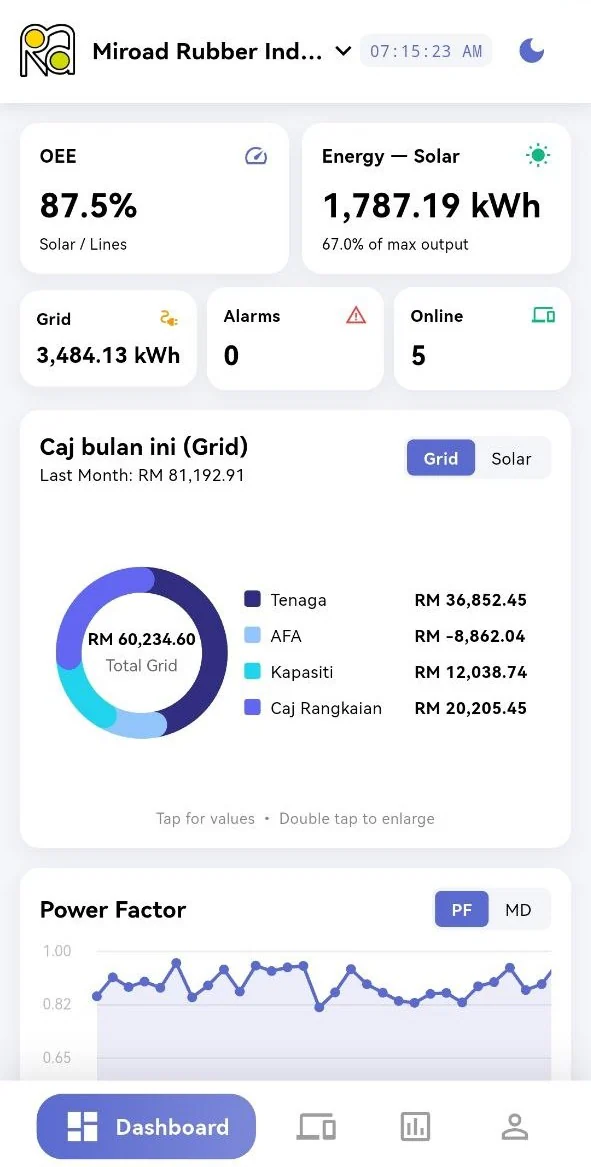
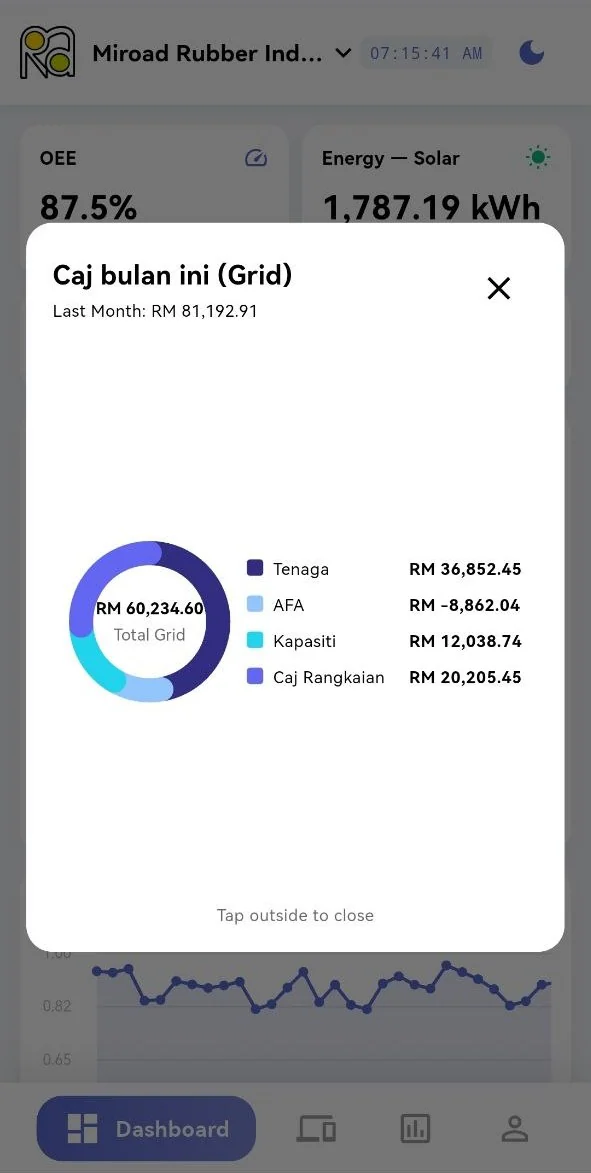
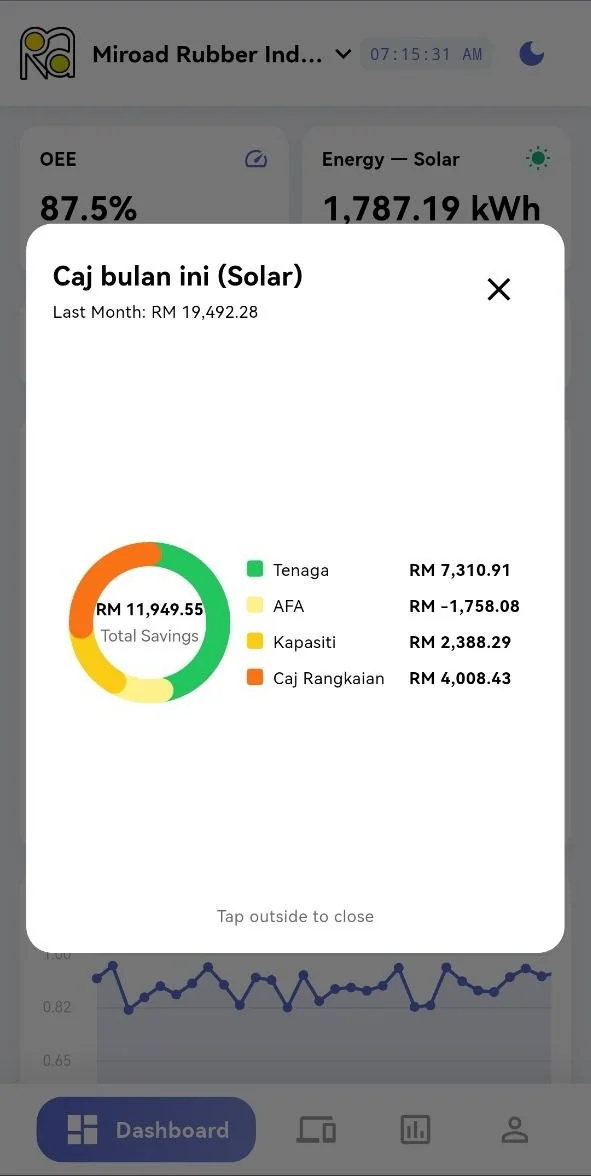
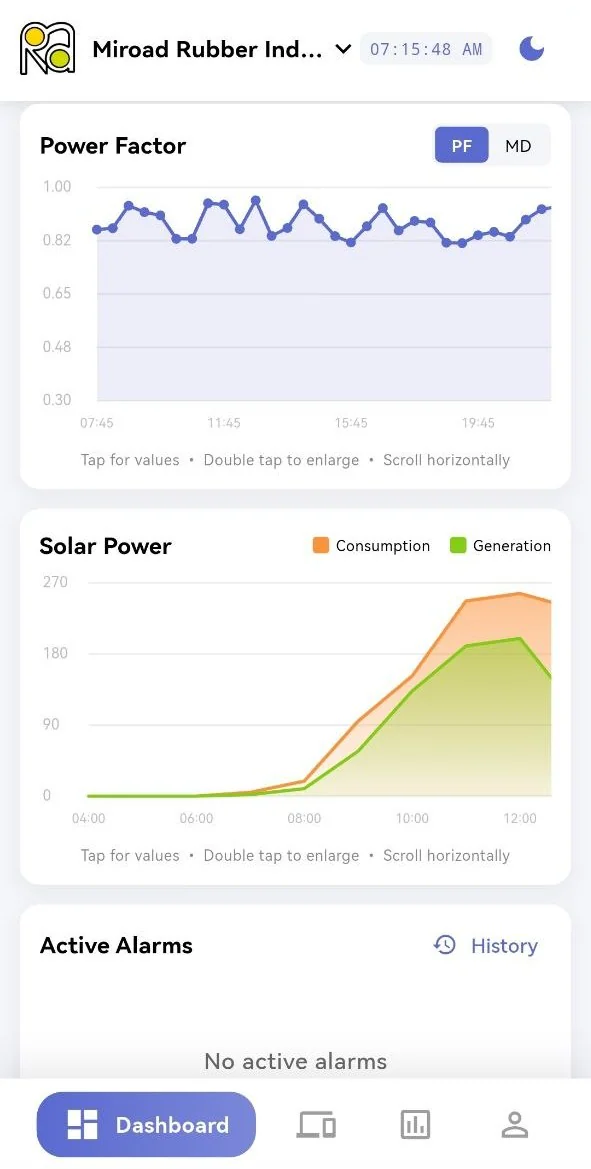
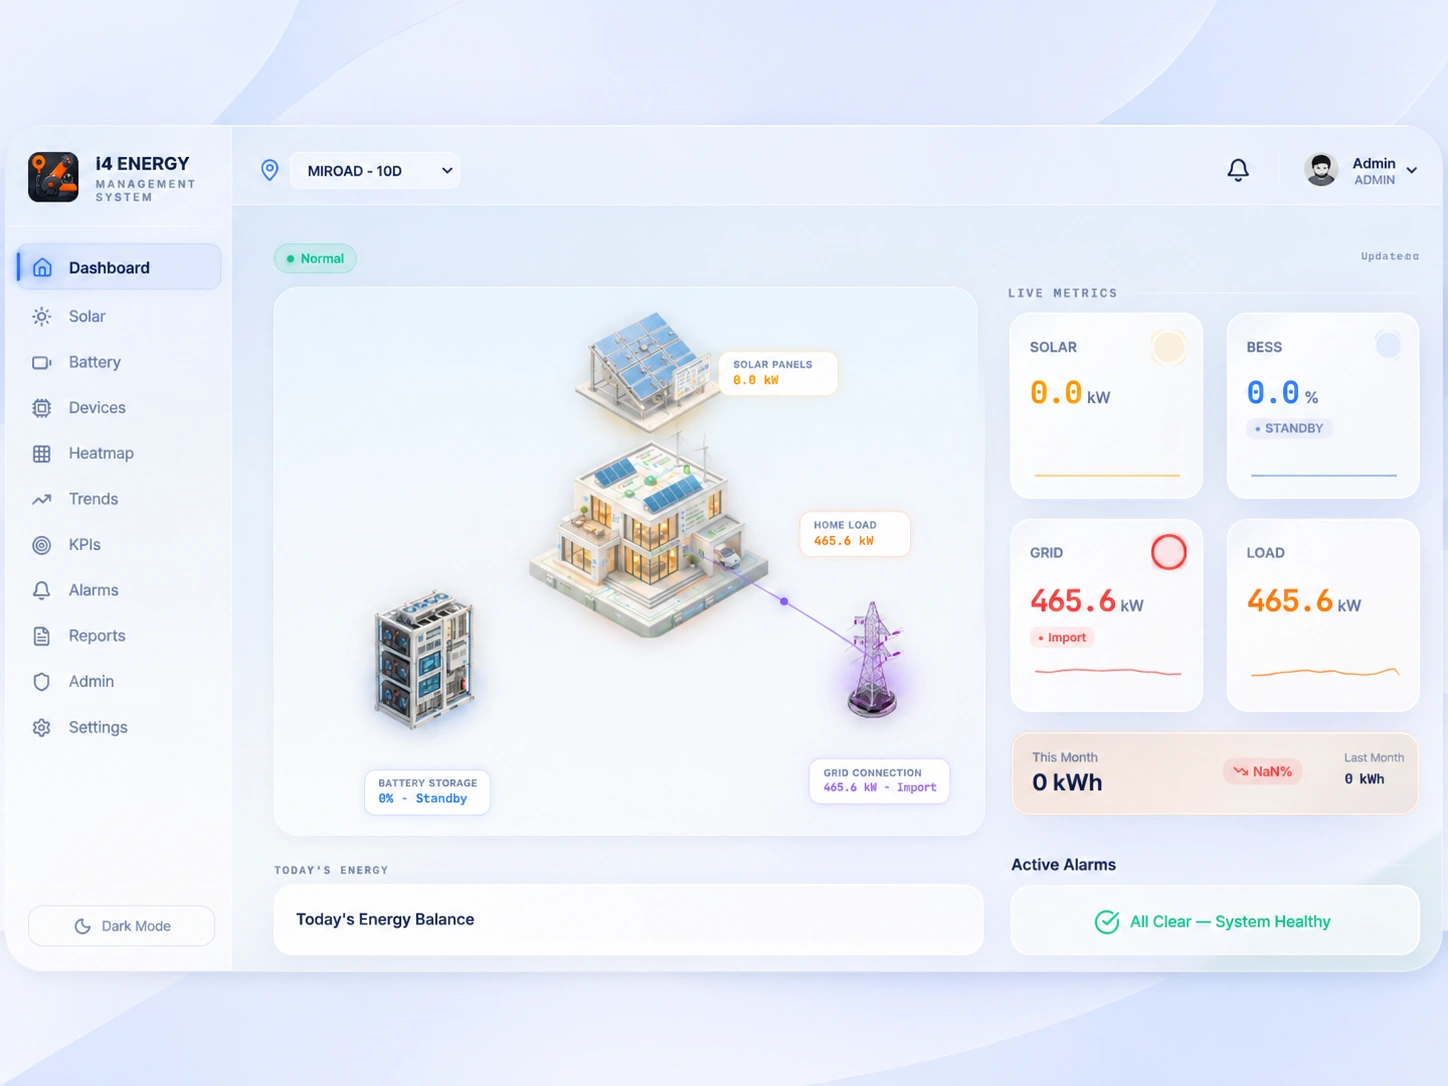
I4 Engineering is a Flutter/Dart Android app for inspecting electrical systems and preparing energy reports. It adapts electrical-monitoring workflows into a portrait-oriented mobile interface with four main areas: Dashboard, Devices, Reports, and Profile. The dashboard brings together energy totals, grid-cost and solar-savings breakdowns, power-factor and demand views, device availability, and alarm/history panels. The Android interface follows the project's original HTML and JavaScript dashboard and reporting layouts.
Company Switching and Device-Specific Metrics
A shared CompanyManager uses ChangeNotifier to coordinate company selection, branding, and device lists across screens. Each company profile can expose a different set of meters and supported readings. Device drill-downs cover three-phase current and voltage, active/reactive/apparent power, power factor, frequency, and energy, with additional measurements for supported meter types. Missing-data states avoid drawing an ordinary chart for devices without readings. Device cards also provide alarm and threshold-parameter views.
Interactive Mobile Charts
CustomPainter-based charts support multiple phase/metric series, point inspection, legends, and enlarged chart dialogs. Users can switch the selected measurement and inspect values in context rather than working through a single static dashboard. Animated transitions, company-selection sheets, a bottom navigation bar, and light/dark themes carry the same visual language between the overview and device-detail screens. Shared Preferences persists theme choice and the local demonstration session.
Monthly and Historical Reporting
The reports screen provides company/month selection for a monthly energy PDF and device, unit, field, interval, and date-range controls for historical reports. Historical views include selectable chart series, range controls, high/low summaries with timestamps, and detailed tables. PDFs are composed with the Dart pdf package, saved through path_provider, and opened through open_filex. The monthly layout combines energy summaries, demand and power-factor figures, tables, and chart sections into a mobile-accessible reporting workflow.
Prototype Data and Implementation Scope
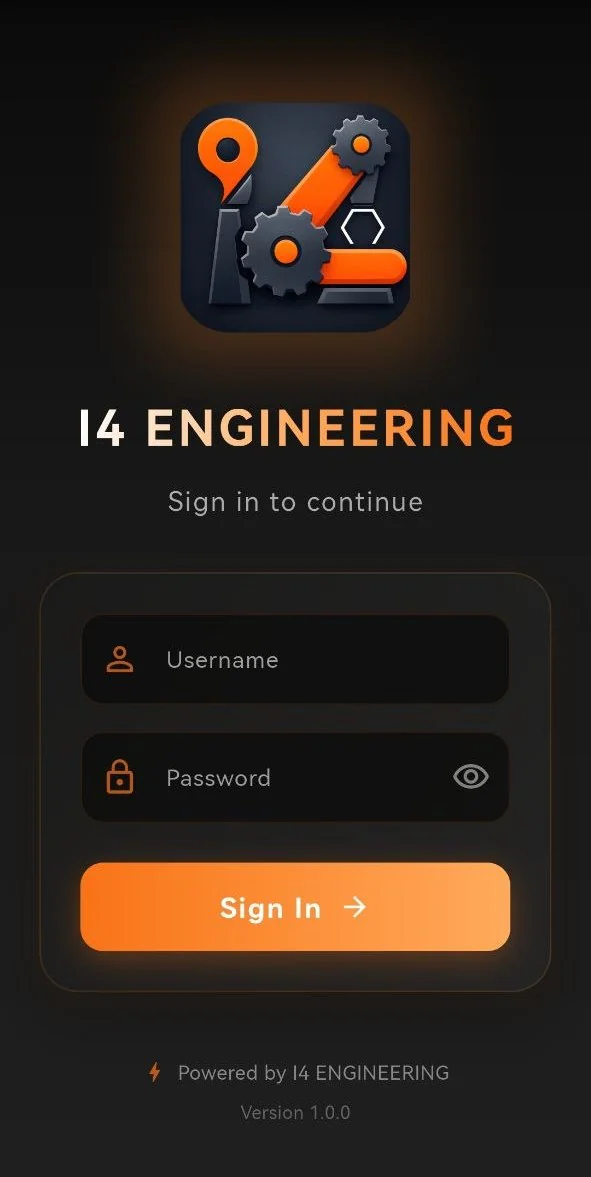
The Android implementation uses a local demonstration-data service, device fixtures, and generated chart/report samples. Its sign-in is a local demonstration flow, and its preferences store session/theme state. The project demonstrates the Android interface, navigation, device modelling, chart interactions, and PDF-generation workflows, with a live telemetry backend remaining a future integration. I4 Energy is the separate project with InfluxDB query integration and web/desktop clients.
Project Gallery
33 items
Explore More Projects
Swipe or click arrows to see other work
 View projectanalyzing project #01
 View projectanalyzing project #02
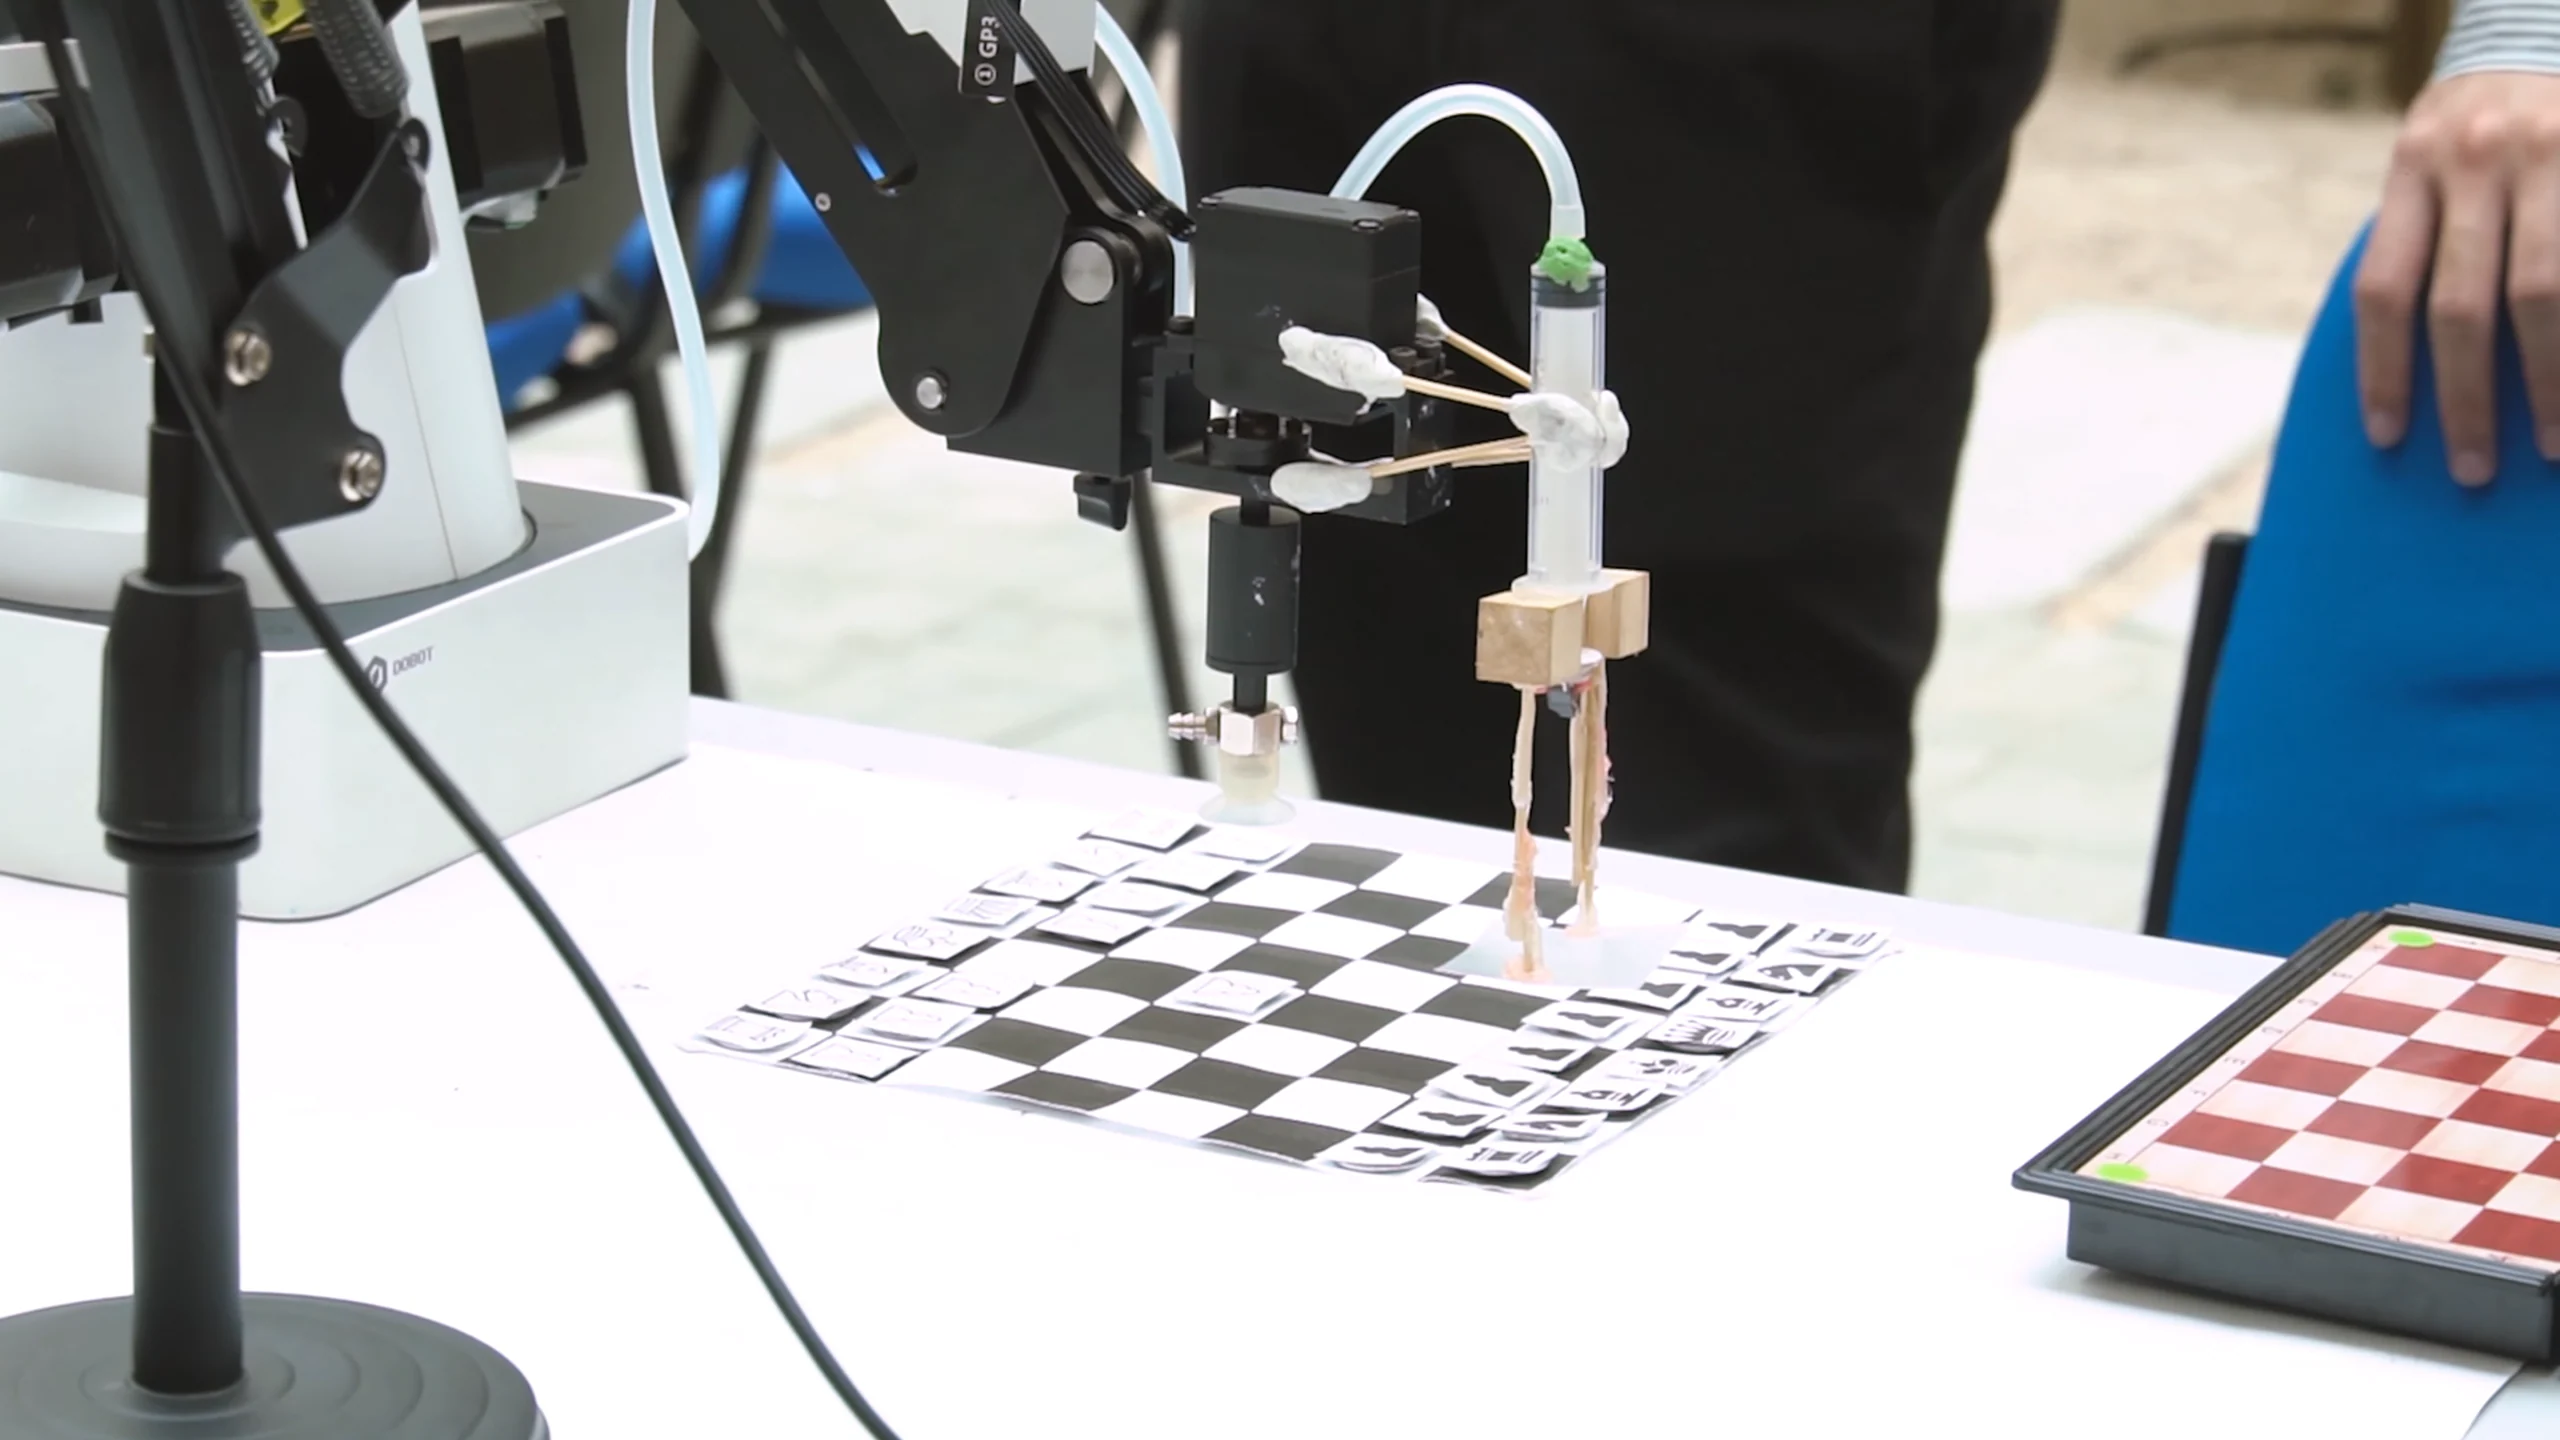 View projectanalyzing project #03
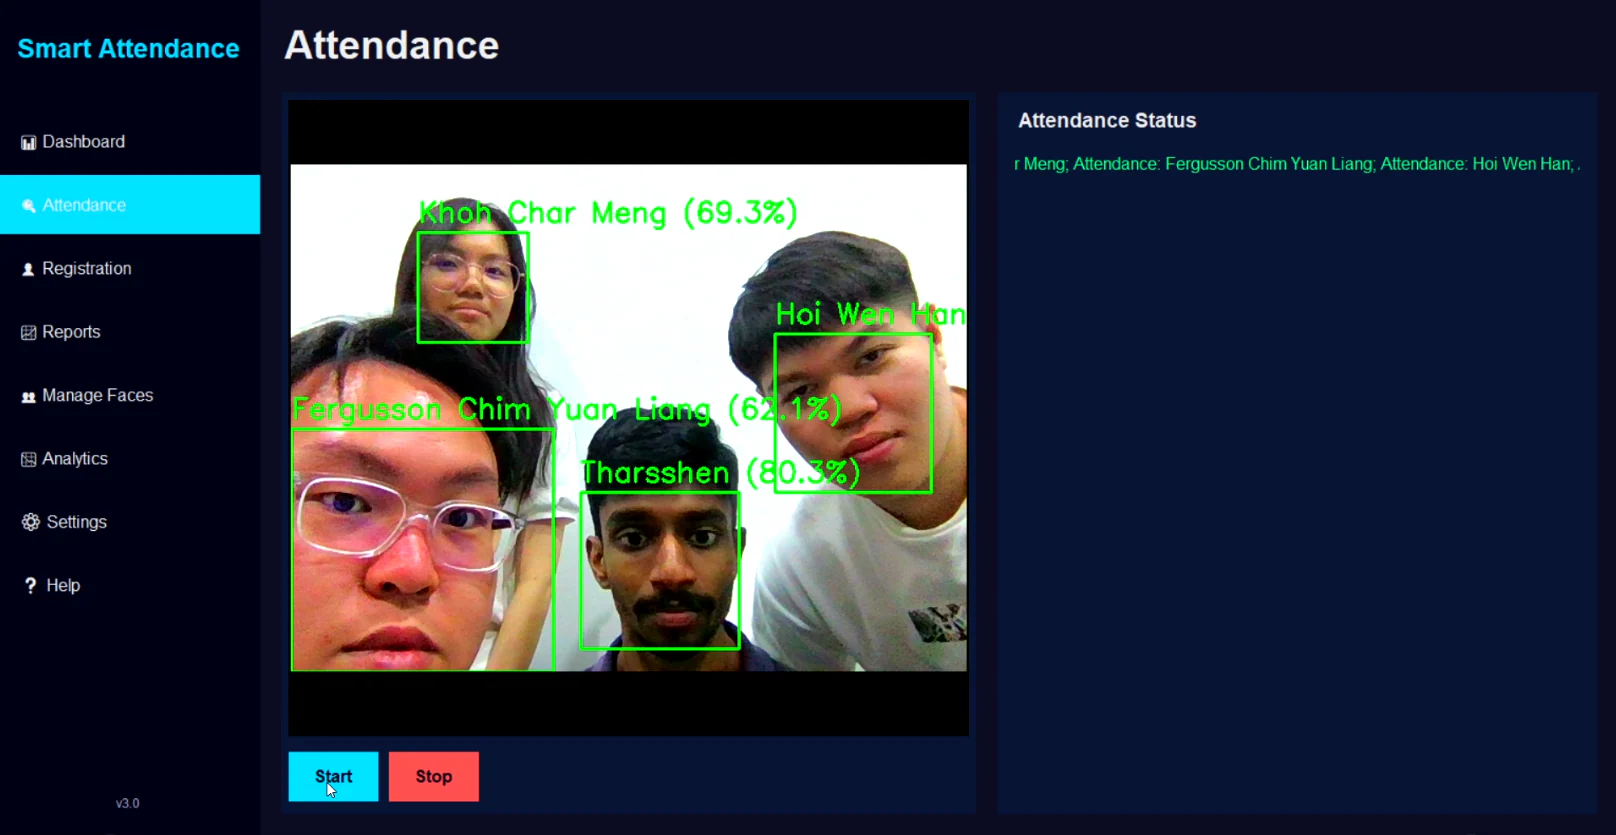 View projectanalyzing project #04
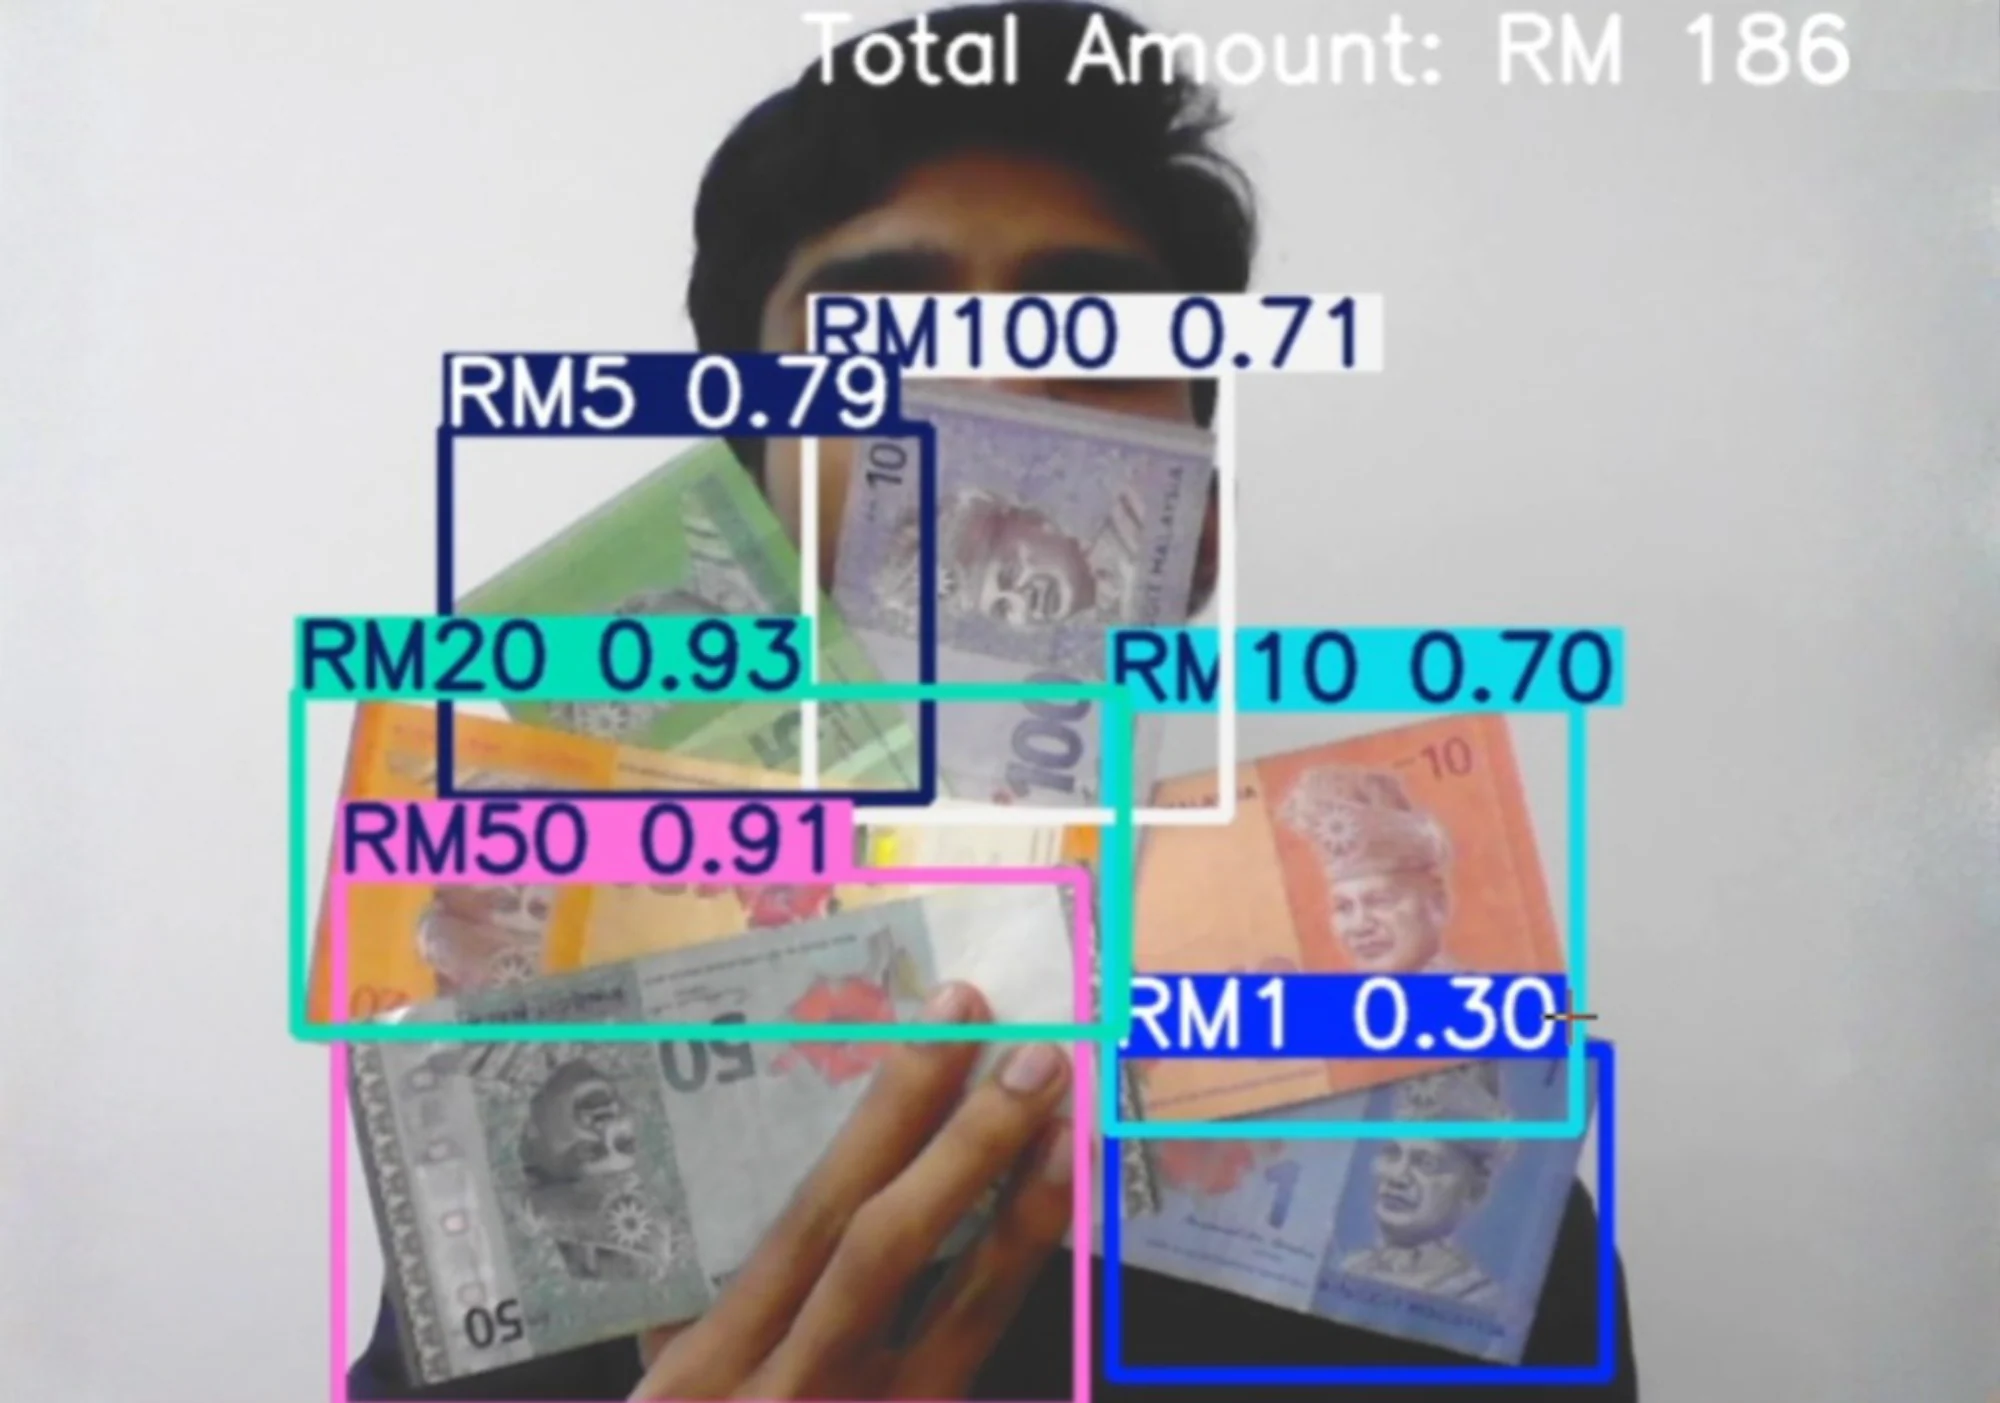 View projectanalyzing project #05
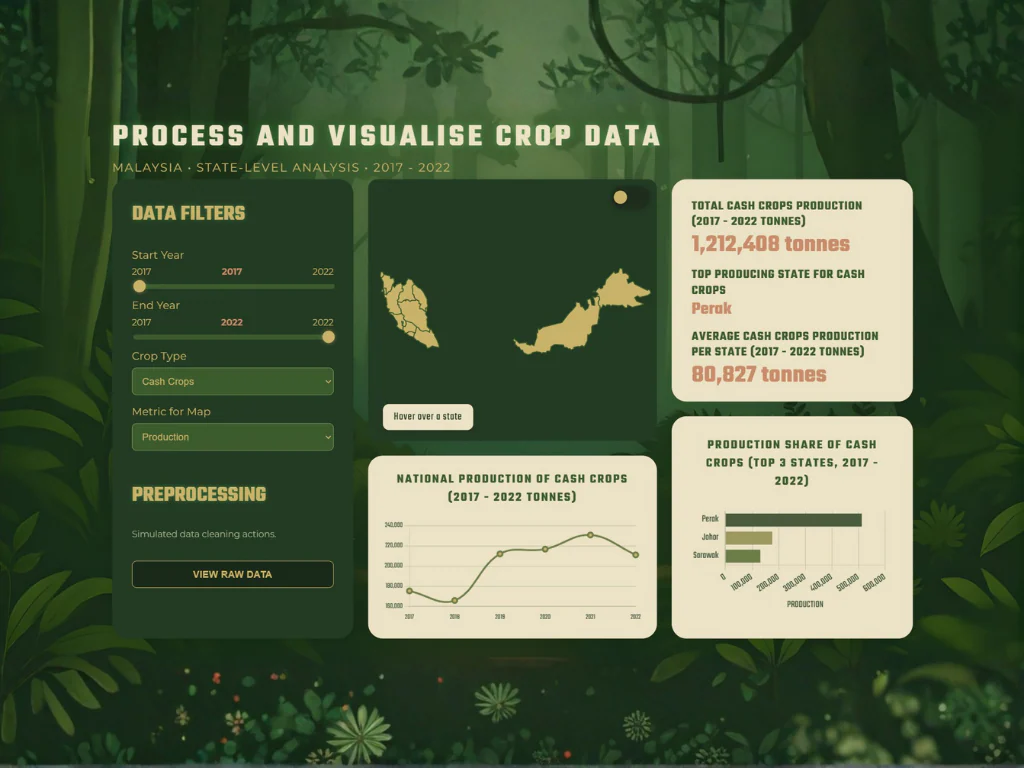 View projectanalyzing project #06
 View projectanalyzing project #07
 View projectanalyzing project #08
 View projectanalyzing project #09
 View projectanalyzing project #10
 View projectanalyzing project #11
 View projectanalyzing project #12
 View projectanalyzing project #13
 View projectanalyzing project #14
 View projectanalyzing project #15
 View projectanalyzing project #16
 View projectanalyzing project #17