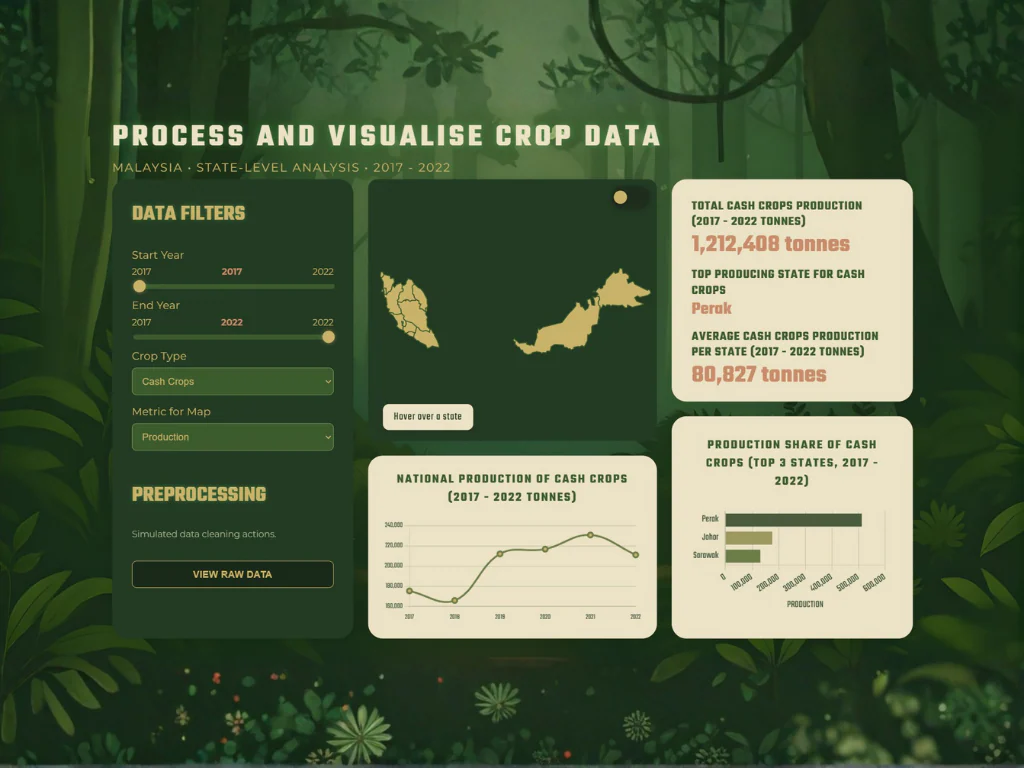
Crops Data Visualisation Dashboard
Interactive Agricultural Analytics for Malaysia State Crop Data
“Analytics becomes actionable when users can clean, explore, and export from one flow.”
Platform Overview
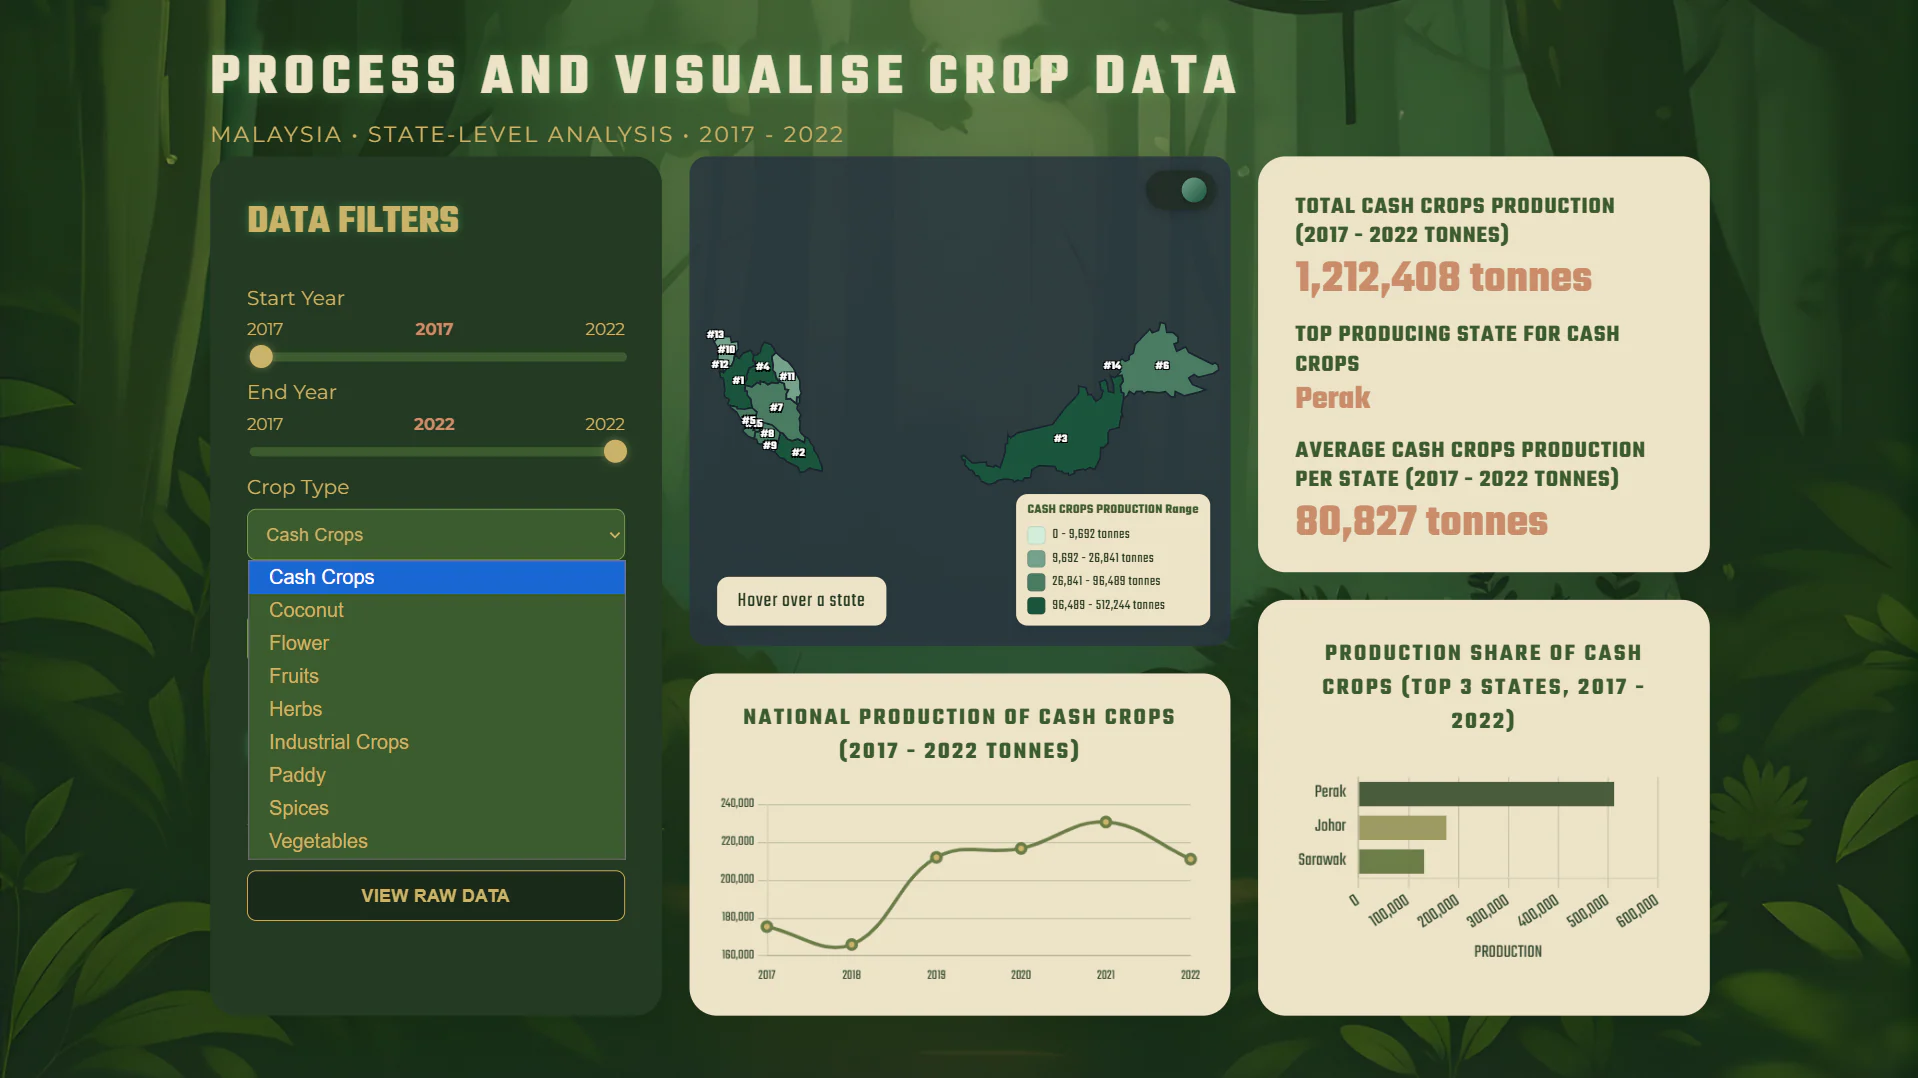
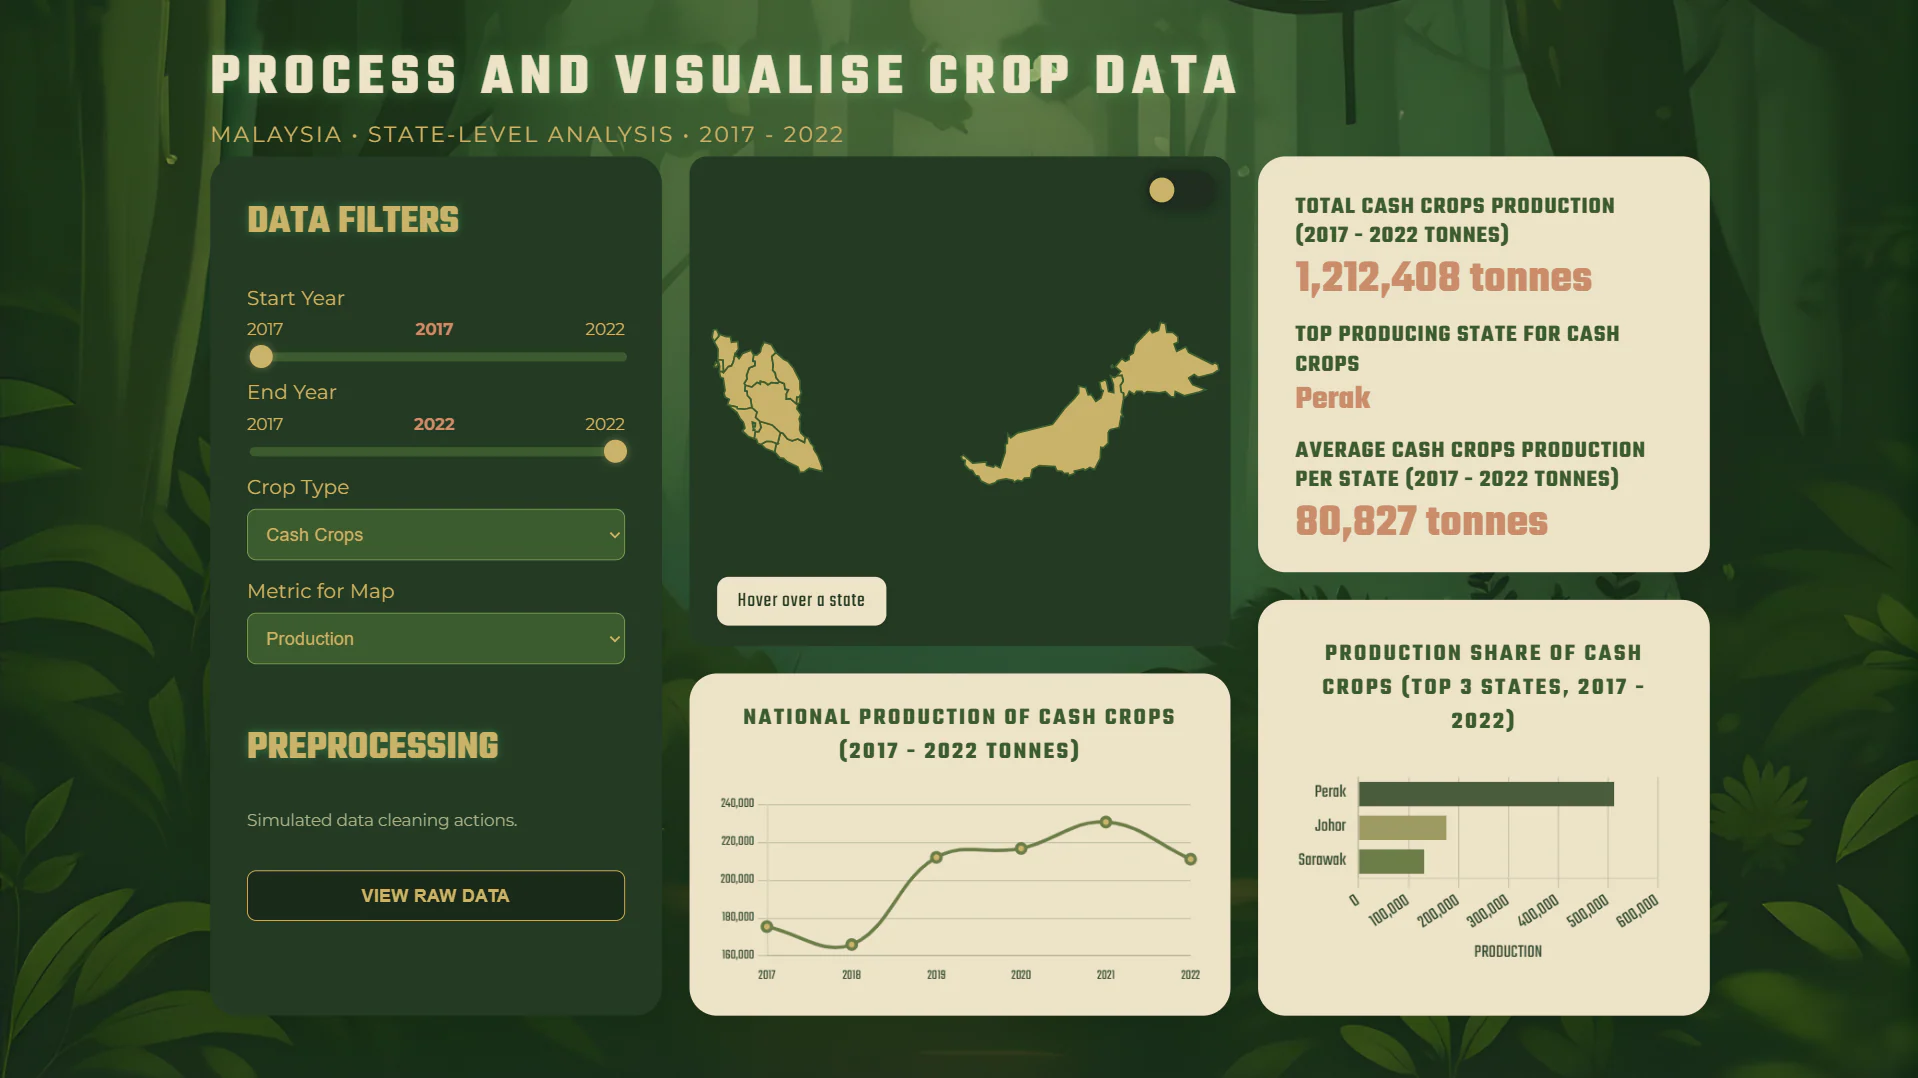
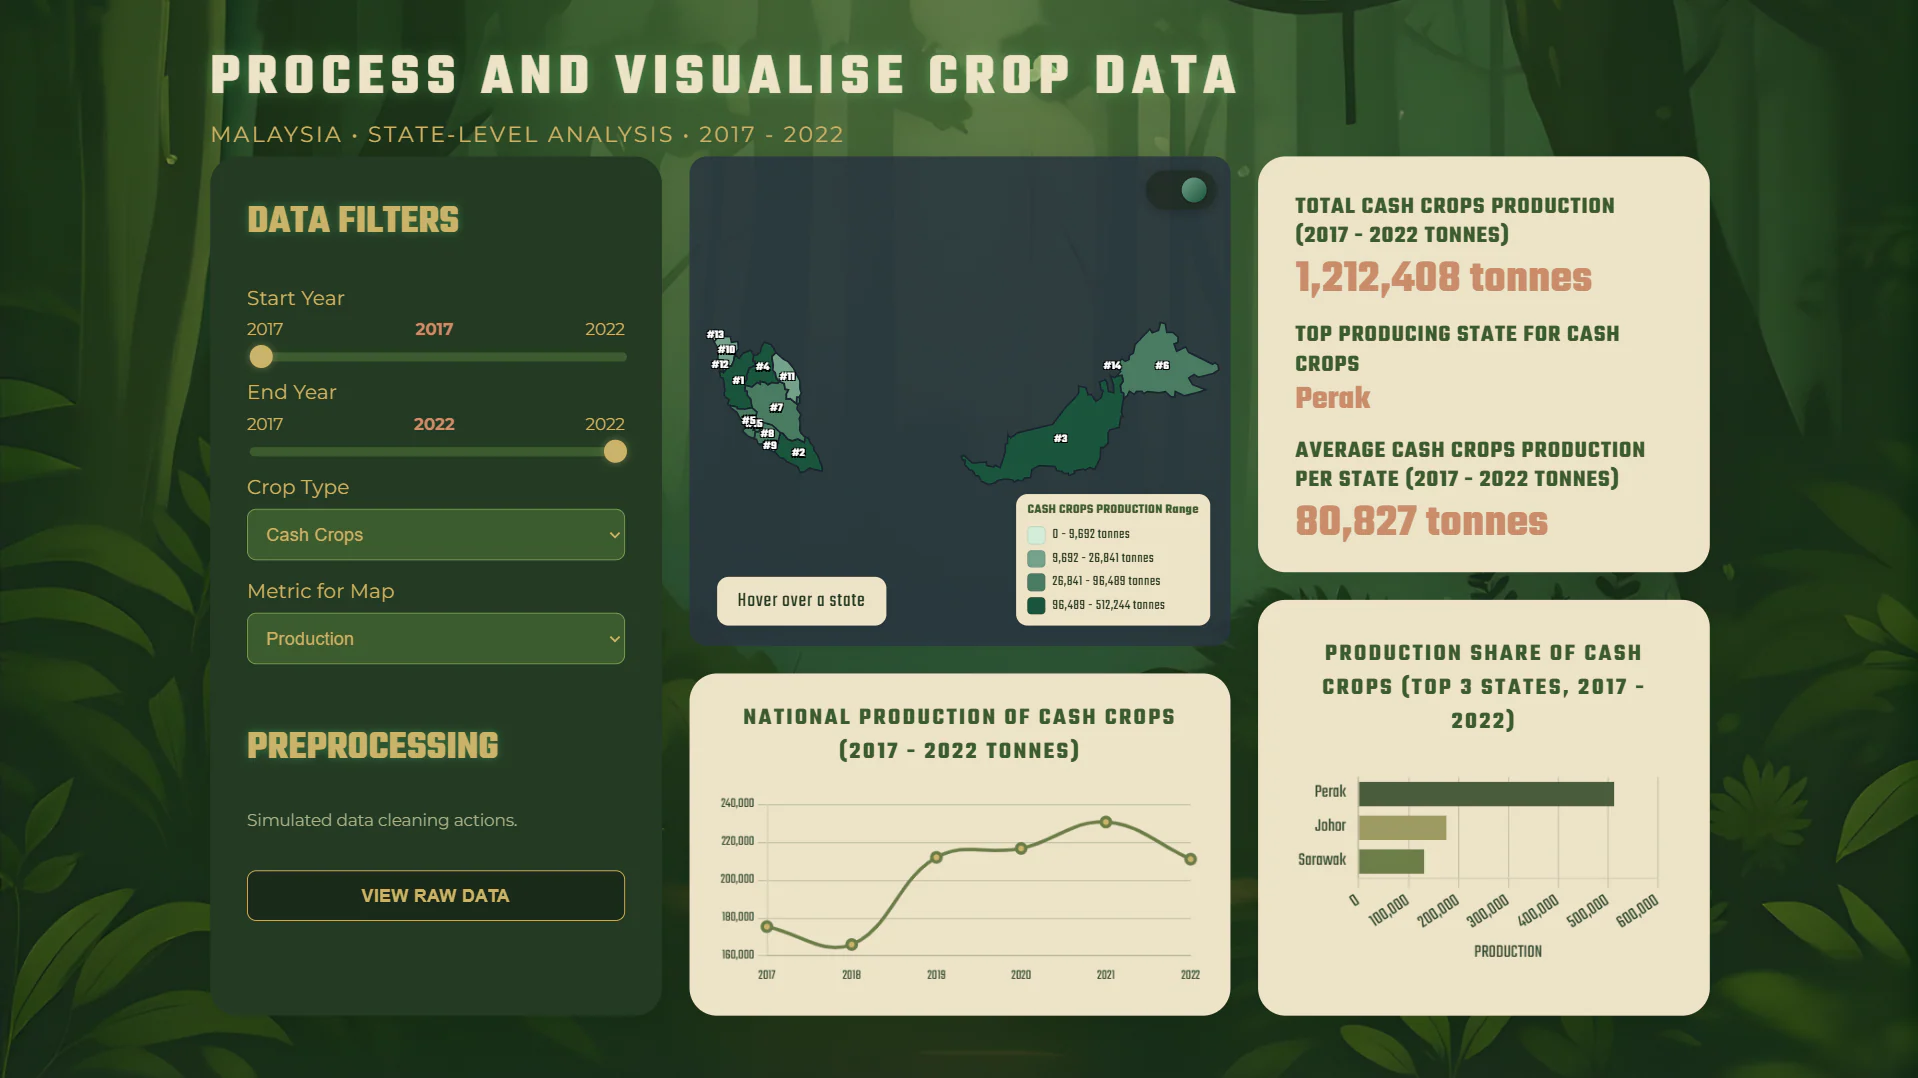
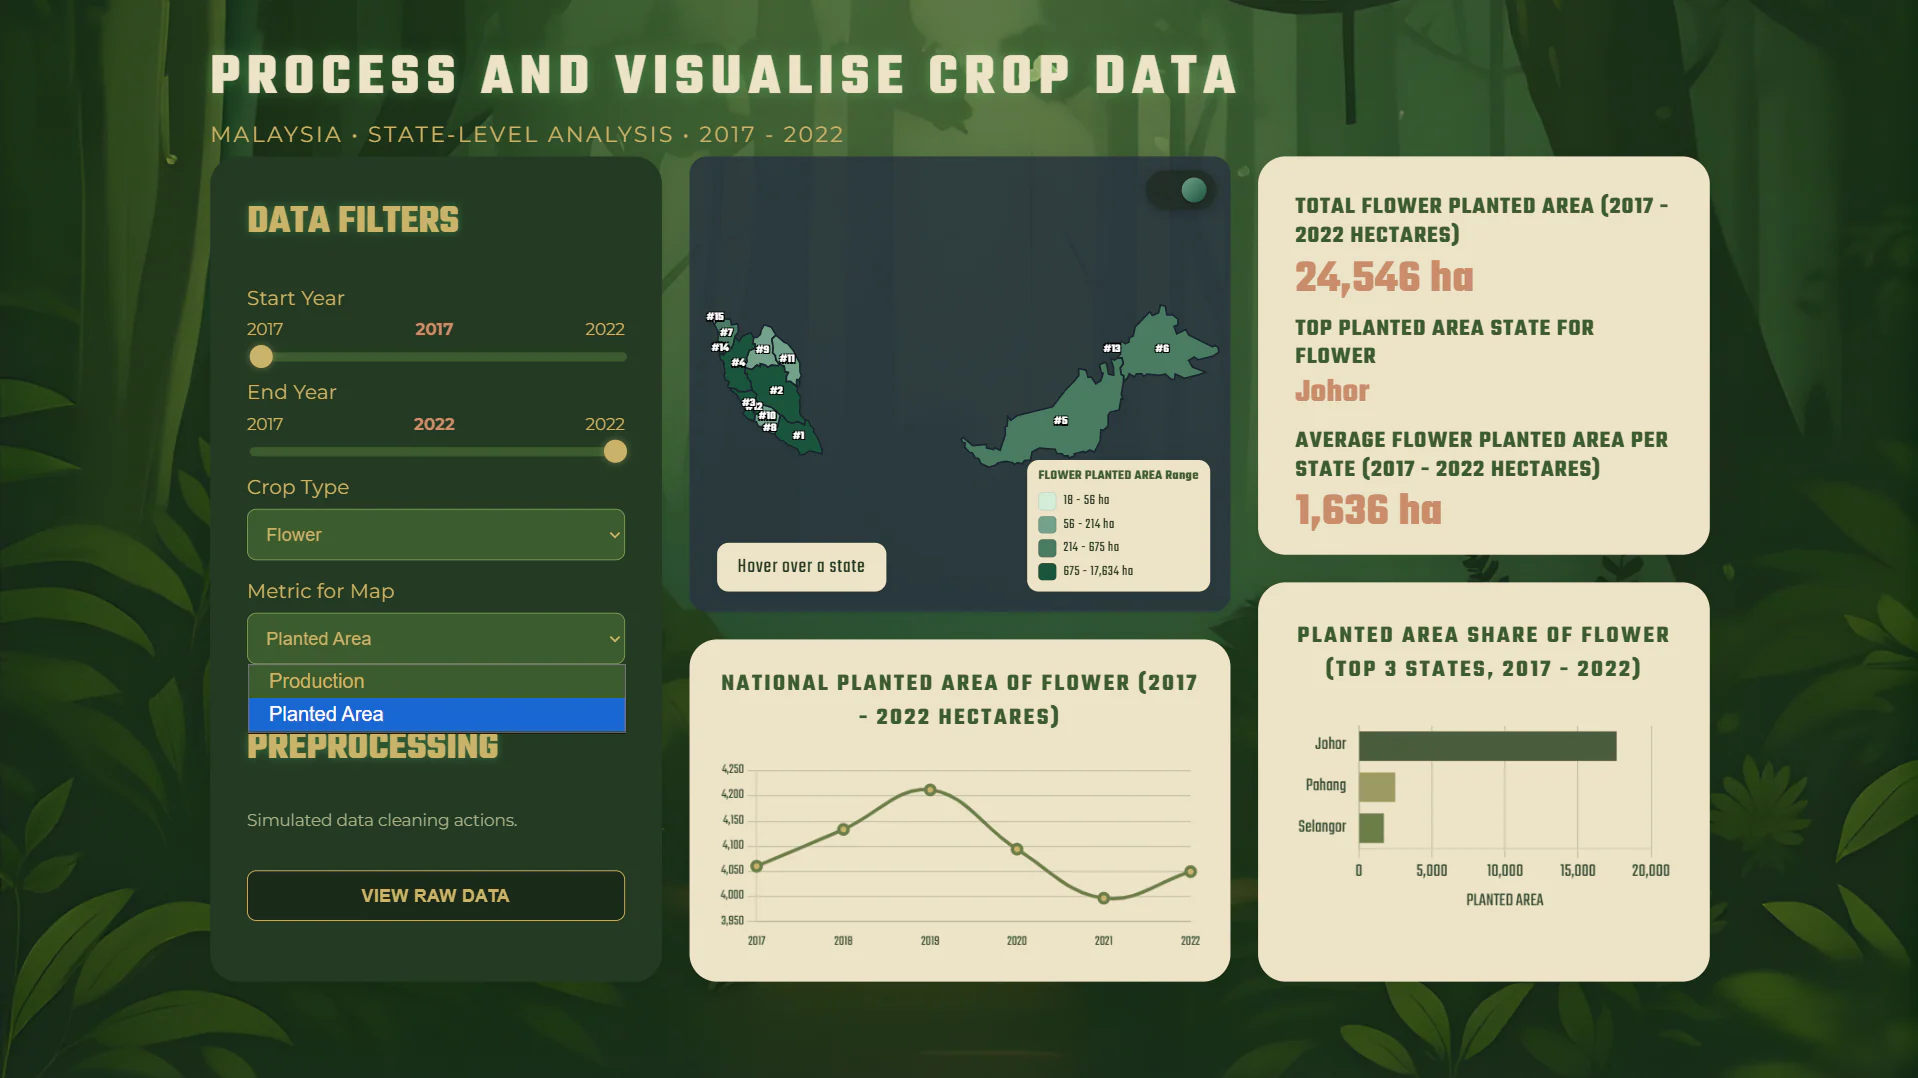
This is a static front-end analytics app built with HTML, CSS, and JavaScript. Users upload a CSV on the landing page, then explore state-level crop data through an interactive Malaysia map, trend charts, top-state comparisons, KPI cards, and ranked insights across year range, crop type, and metric selections.
Data Pipeline and Quality Workflow
Data is loaded from sessionStorage upload context with fallback to local CSV, parsed into raw and clean datasets, standardized for state-name consistency, and re-aggregated on each filter change. A Raw Data Logs sidebar supports duplicate and invalid-row handling, missing-value imputation, and geospatial coverage diagnostics with live re-rendering.
Visualization and Export
D3 and TopoJSON power map rendering with click-to-drill interactions and zoom/pan, while Chart.js renders national trends and top-state comparisons. State deep-dive pages generate dynamic infographic summaries and support TXT and PDF exports using Blob, html2canvas, and jsPDF.
Project Gallery
21 items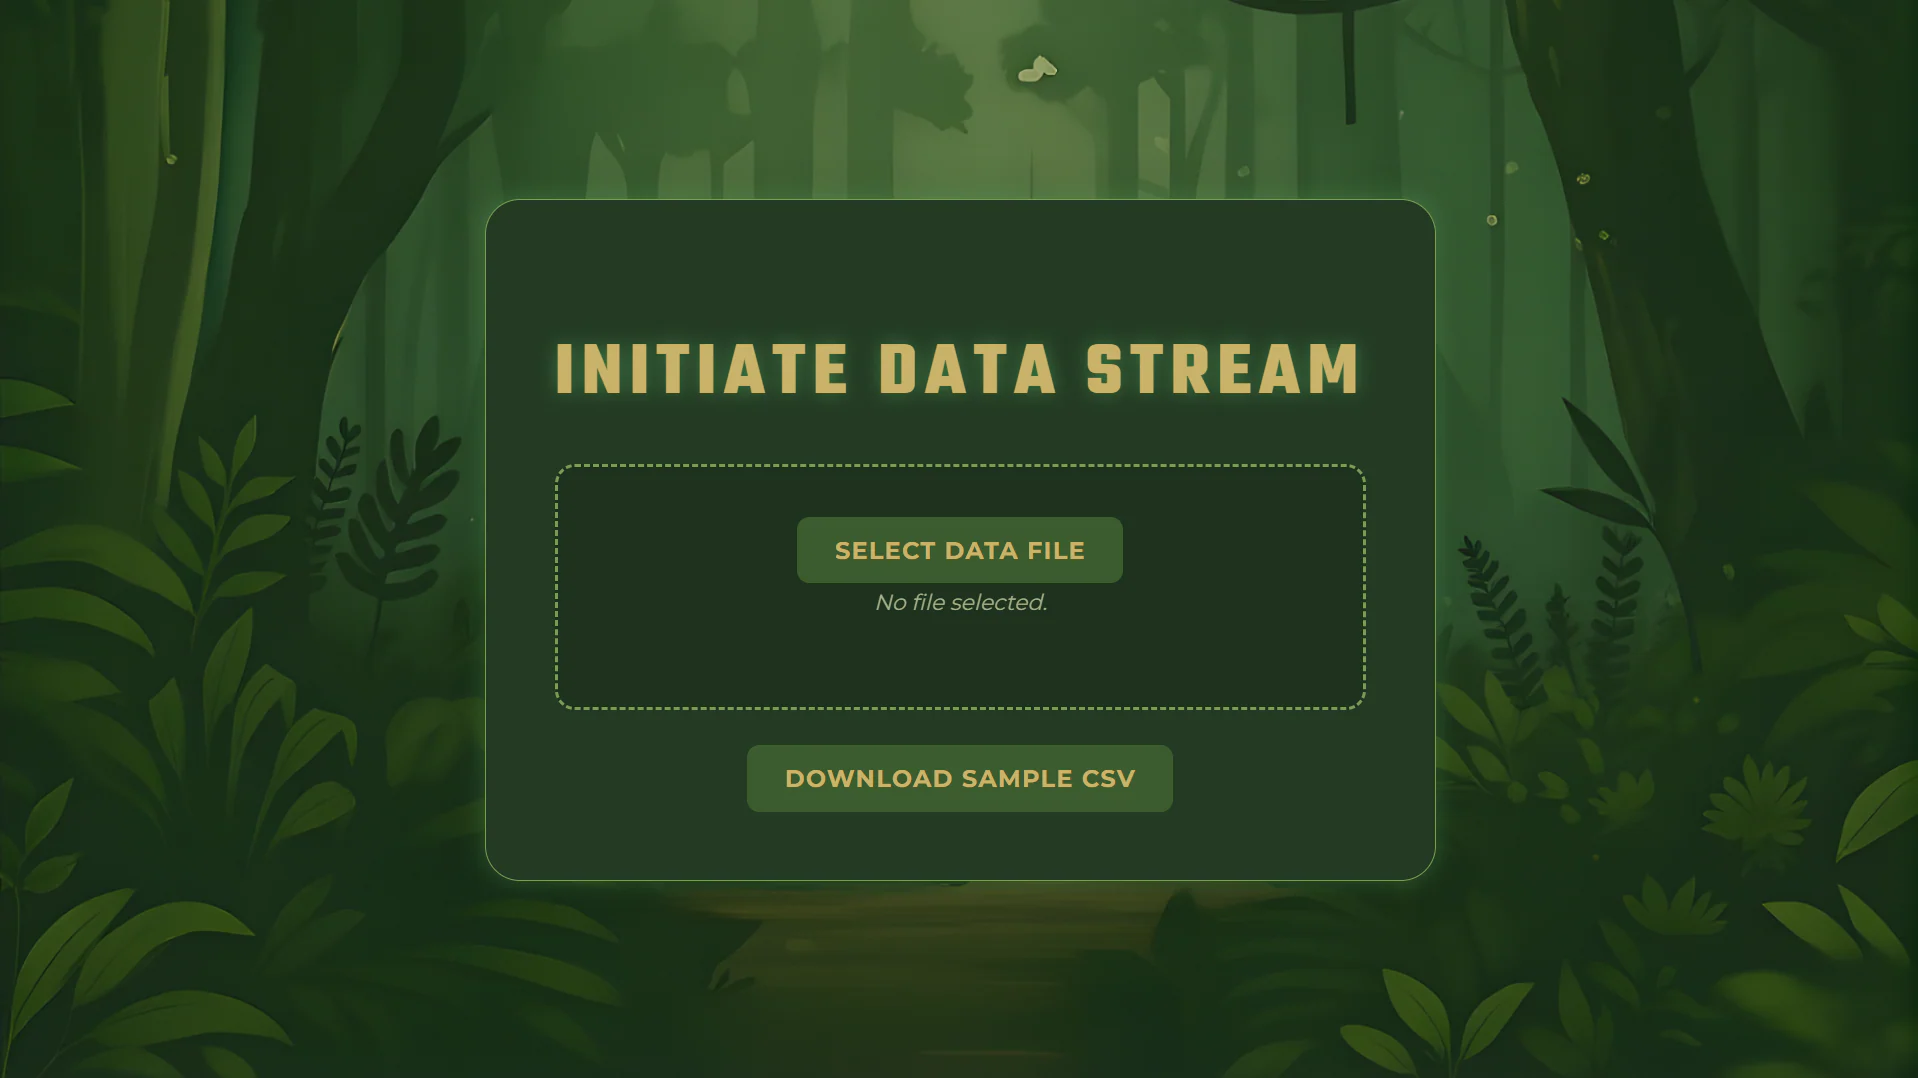
Explore More Projects
Swipe or click arrows to see other work
 View projectanalyzing project #01
 View projectanalyzing project #02
 View projectanalyzing project #03
 View projectanalyzing project #04
 View projectanalyzing project #05
 View projectanalyzing project #07
 View projectanalyzing project #08
 View projectanalyzing project #09
 View projectanalyzing project #10
 View projectanalyzing project #11
 View projectanalyzing project #12
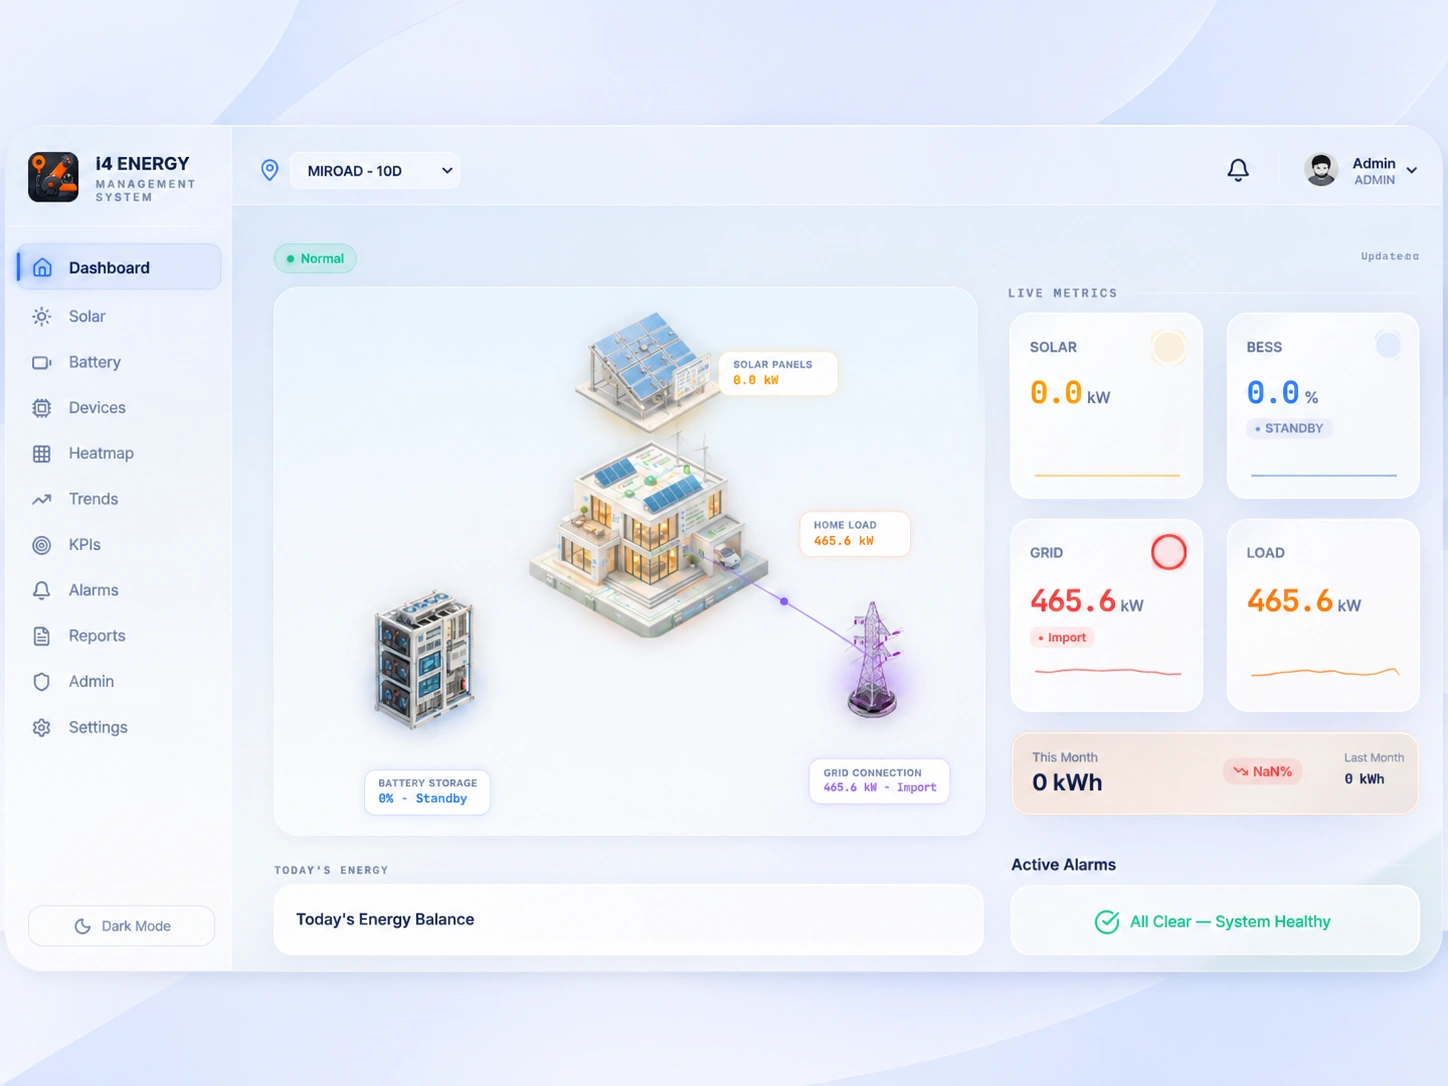 View projectanalyzing project #13
 View projectanalyzing project #14
 View projectanalyzing project #15
 View projectanalyzing project #16
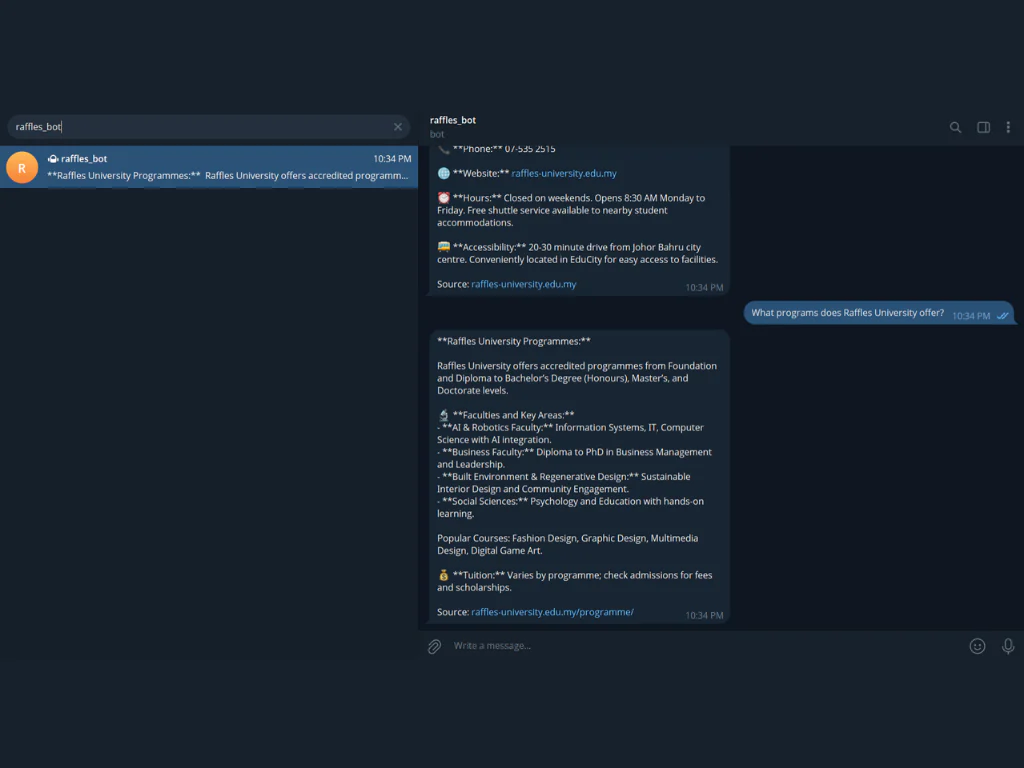 View projectanalyzing project #17
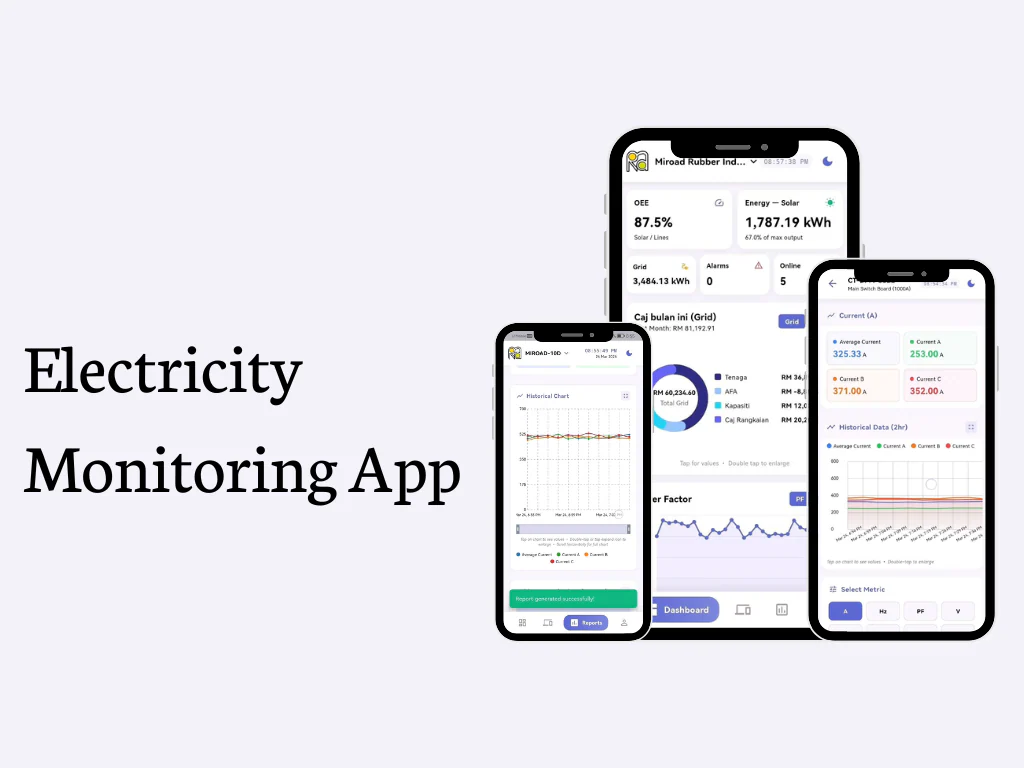 View projectanalyzing project #18